Live Telemetry & Diagnostics Bar
Live Performance & Diagnostics Bar
The Performance Bar in sshs3 is a compact, real-time telemetry strip positioned directly above terminal sessions. It offers continuous visibility into remote host health and resource saturation without requiring sysadmins to open a second window to run top, htop, or vmstat.

Strict Opt-In for Zero Resource Overhead: The performance bar is disabled by default (Settings → Performance). While disabled, zero polling loops run, zero background commands execute, and zero network traffic is generated.
1. Agentless SSH Telemetry via ControlMaster & /proc
Unlike traditional monitoring agents (Datadog, Prometheus node_exporter, Zabbix), sshs3 requires zero software installation on target servers.
Feature: Non-Invasive /proc Sampling
🎯 Purpose
Provide sysadmins with immediate visual feedback regarding resource bottlenecks (CPU compile spikes, memory leaks, I/O wait on slow disks, hypervisor steal) without requiring agent daemons or credentials.
🛠️ How to Use
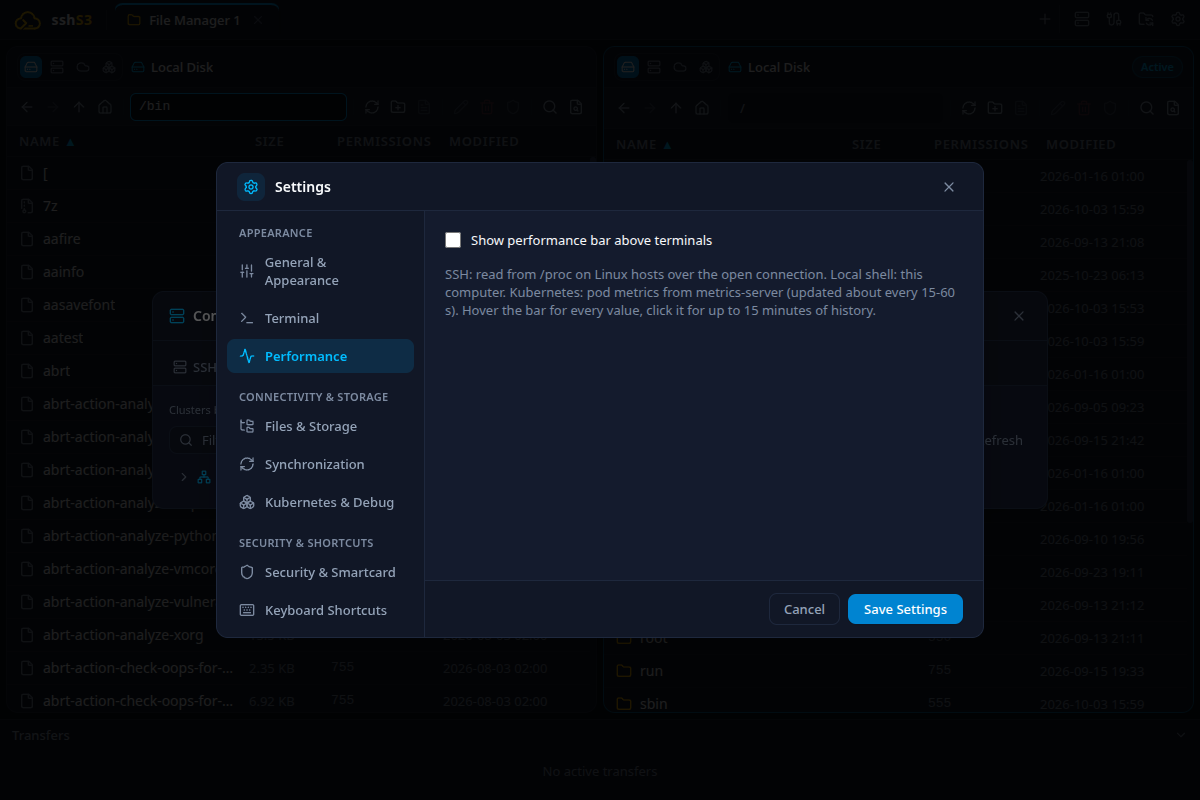
- Open Settings → Performance and tick Show performance bar above terminals.
- Choose a display mode:
- Compact Text: Clean textual readouts (e.g. CPU: 14% | RAM: 3.8/16 GB | Load: 0.42 | Ping: 8ms). - Bars: Color-coded meters that dynamically shift from green to amber and red during high load. - Sparklines: Real-time miniature line graphs charting recent history.
- Select an update interval (2s, 5s, 10s, or 30s).
- Hover over the bar: Reveals a comprehensive tooltip listing all available metrics for that session, including fields not selected in the compact bar.
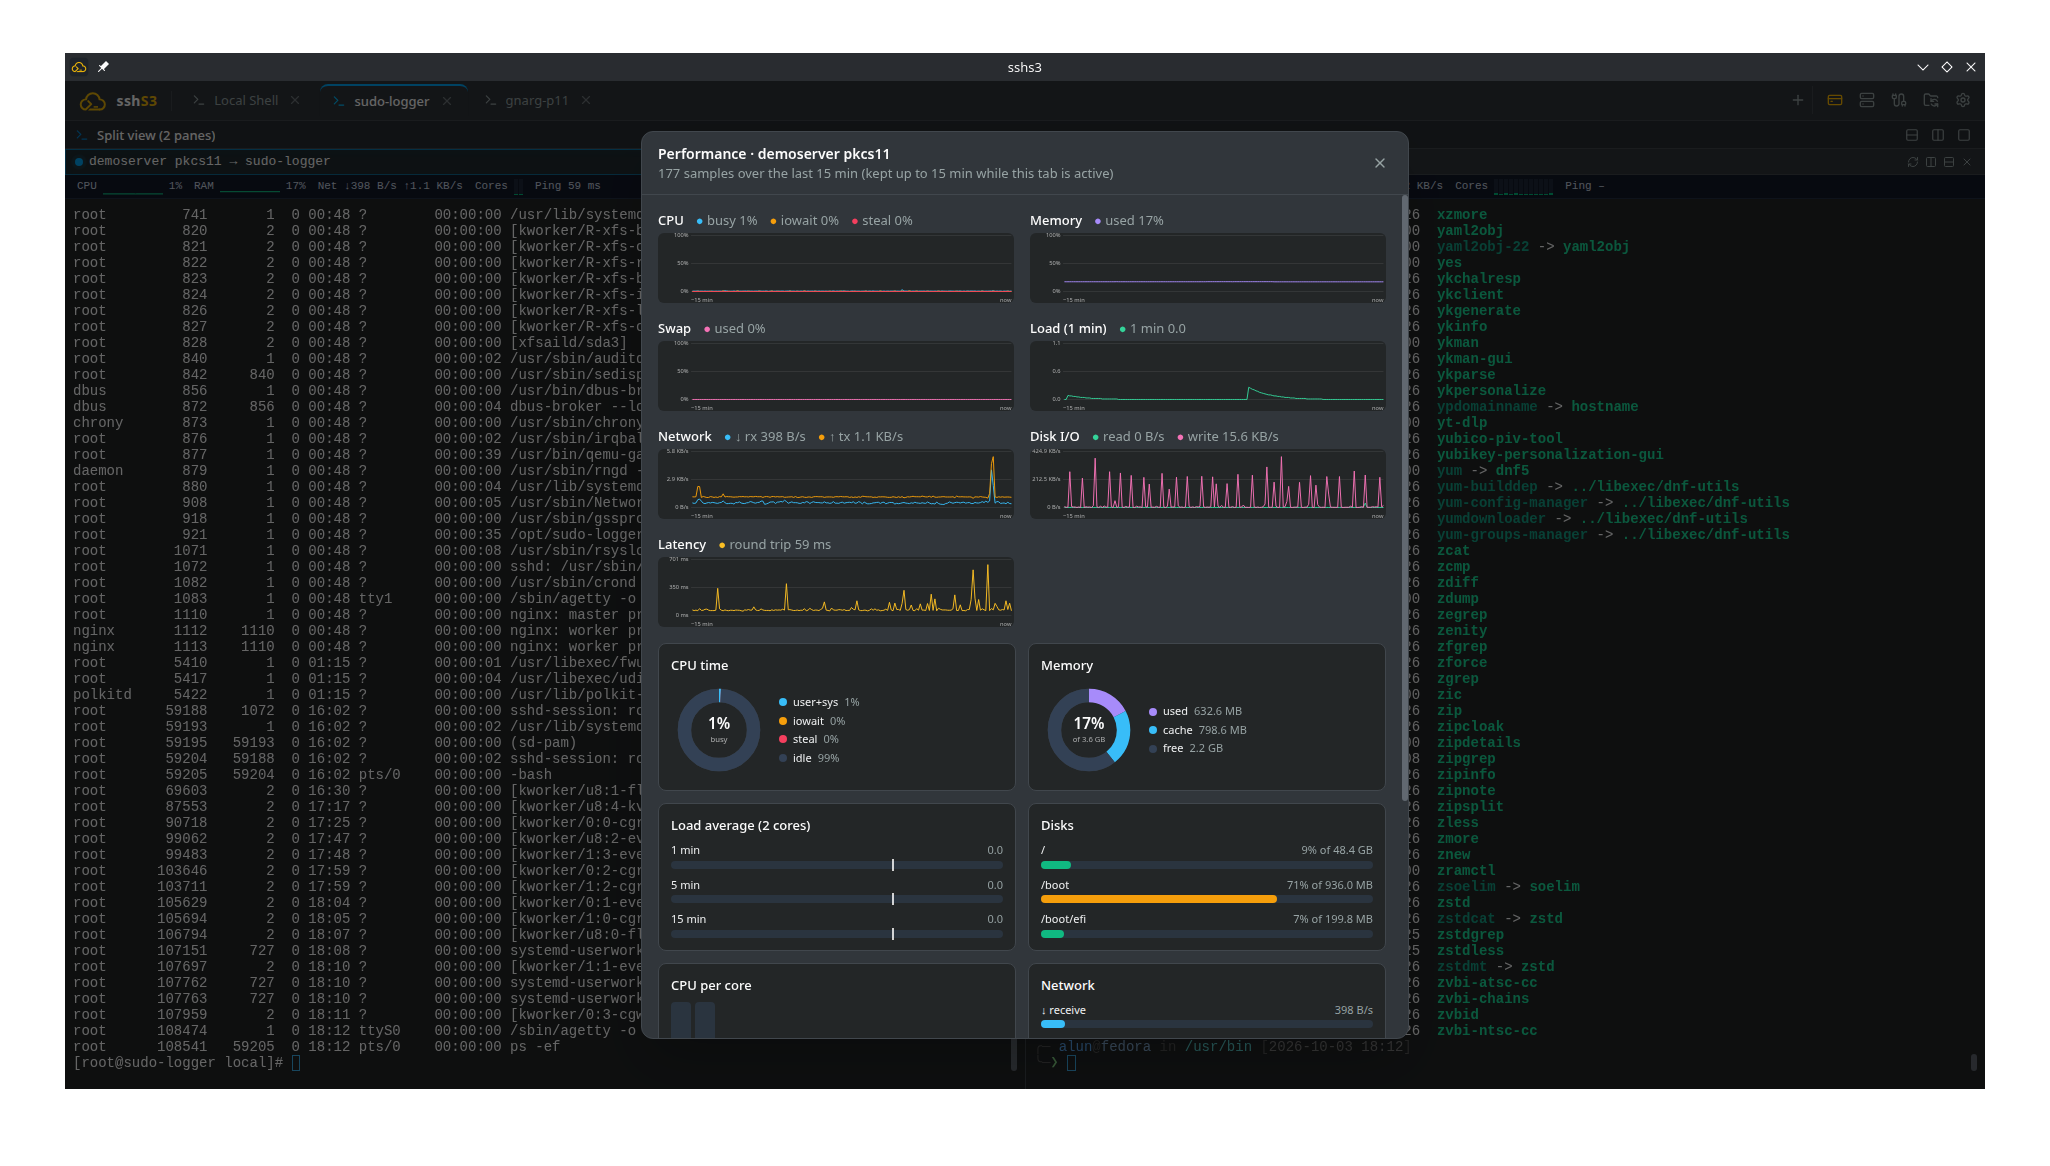
- Click the bar: Opens the 15-minute diagnostic history view featuring time-series charts and donut meters for CPU time (user, system, iowait, steal), memory allocation (used, cache, free), and disk capacity.
⚠️ Limitations & Caveats
- SSH telemetry requires Linux servers with a mounted
/procvirtual filesystem (standard across RHEL, Debian, Ubuntu, Rocky, Alpine, Arch, etc.). - On Windows workstations, the sampling interval is enforced to a minimum of 10 seconds to eliminate TCP socket overhead.
- Non-Linux platforms (FreeBSD, OpenBSD, AIX) are not supported by the
/procparser.
⚙️ Technical Internals & Architecture
Sampling executes over the already active OpenSSH ControlMaster socket used by the terminal:
- The argument
-o BatchMode=yesis strictly enforced, guaranteeing that samples never trigger password prompts, smartcard PIN dialogs, or YubiKey touch requests. - Each sample runs an atomic, read-only POSIX inspection command:
cat /proc/stat /proc/meminfo /proc/loadavg /proc/net/dev 2>/dev/null- Raw metrics are parsed inside Node.js by
PerfMetricsService(src/main/services/PerfMetricsService.ts) and pushed across IPC to React. Samples timeout after 3 seconds to avoid terminal stalls.
2. Kubernetes Pod Telemetry (metrics.k8s.io)
When connected to a container exec terminal, the performance bar automatically switches into Kubernetes telemetry mode.
Feature: Real-Time Container Resource Telemetry
🎯 Purpose
Give DevOps engineers immediate insight into container resource consumption relative to its configured Resource Requests and Limits, alerting against potential OOMKilled evictions or CPU throttling.
🛠️ How to Use
- Open an exec session in any pod.
- The performance bar renders container CPU and memory usage against configured limits, restart counters, pod age, node location, and Ready state.
⚠️ Limitations & Caveats
- Requires an active
metrics-serverdeployment in the cluster. If absent, the indicator displays "metrics-server not available". - The Kubernetes Metrics API refreshes every 15–60 seconds; sshs3 polls at most once every 10 seconds to avoid API server load.
⚙️ Technical Internals & Architecture
An authenticated HTTPS request is sent directly to the Kubernetes API server via @kubernetes/client-node: /apis/metrics.k8s.io/v1beta1/namespaces/{ns}/pods/{name} The resulting usage metrics are reconciled against the pod's PodSpec definition.
3. Telemetry Metric Reference Table
| Metric | Source / API | Operational Diagnosis |
|---|---|---|
| CPU Total & Per Core | /proc/stat | Percentage utilization across total and individual logical CPU cores. |
| RAM & Page Cache | /proc/meminfo | Application memory allocation vs OS page cache (Buffers/Cached). |
| Load (1m / 5m / 15m) | /proc/loadavg | System run-queue saturation relative to total CPU core count. |
I/O Wait (iowait) | /proc/stat | CPU cycles blocked waiting on storage disk operations. |
CPU Steal (steal) | /proc/stat | CPU cycles taken by the hypervisor (detects noisy neighbors in VPS/cloud). |
| Disk Capacity | statvfs() | Percentage utilization across / and all mounted filesystems. |
| Network I/O (↓/↑) | /proc/net/dev | Real-time network throughput in bytes/s across network interfaces. |
| Disk Throughput | /proc/diskstats | Block device read/write throughput in MB/s. |
| Latency ("Ping") | TCP RTT | Round-trip socket latency in milliseconds over the active SSH channel. |
4. Troubleshooting & Diagnostics Runbook
| Symptom / Error Message | Probable Root Cause | Corrective Action |
|---|---|---|
| No metrics bar appears above terminal | Feature disabled in settings | Open Settings → Performance and tick Show performance bar above terminals. |
metrics-server not available | Kubernetes cluster lacks metrics-server | Deploy metrics-server to your cluster (kubectl apply -f https://github.com/kubernetes-sigs/metrics-server/...). |
Ping metric displays N/A | ControlMaster connection multiplexing disabled | Socket RTT requires connection multiplexing. Ensure ControlMaster is supported by your server. |
| Metric updates stall | Server under extreme load or network dropped | Sampler enforces a 3-second timeout. Updates resume automatically once the host responds. |